RCM Market Size | 2026
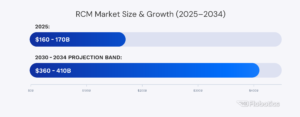
Global RCM (software + services) was typically estimated around $160–170B in 2025.
Different sources scope the U.S. market differently (software only vs software + services), but they all agree on strong double-digit growth and a large, maturing industry. They also estimate RCM growth at ~9–12% CAGR into the early 2030s.
Ensemble’s targeted ~$13B valuation, Waystar/Iodine and R1 RCM buyout were good M&A signals that support this scope.
Here’s our summary of the 2025 in terms of RCM statistics.
NPS & Patient Behavior | 2026
The definition of patient loyalty has shifted.
The passive patient who stayed with a provider out of habit is extinct.
In their place is the 2025 healthcare consumer:
- financially invested,
- digitally empowered,
- willing to churn.
In other words:
Patient loyalty in healthcare is increasingly shaped by operational experience rather than clinical outcomes alone.
That is exactly why 2025 reports showed that B2B healthcare services lag significantly behind consumer expectations, with average NPS scores stagnating at +38.
Traditional health systems are losing ground.
Weighed down by disjointed care coordination and billing friction, many hospitals struggle to break the +50 mark. The message from the market is clear: clinical excellence is no longer enough to guarantee a high score. The experience gap between “retail healthcare” and “system healthcare” is widening.
The industry average hovers near +61. Direct-to-consumer (B2C) models like One Medical or Hims are setting the pace, often exceeding scores of +70. They trade on retail-like convenience and seamless interfaces.
Net Promoter Score (NPS) remains the industry’s North Star. But it is not the only KPI worth tracking. If you’d like to learn more about it, click here to read our article on Key RCM Metrics.
The “Walk-Away” Economy
Digital “front doors” and transparent online reviews allow patients to shop for care like they shop for retail goods.
That’s why 70% of healthcare consumers stated in 2025 they will switch providers if communication standards are not met.
A Medical Economics report highlights the volatility of this new base.
If communication fails to meet expectations, the majority of patients are now prepared to leave. The threshold for error is thin. In the general customer experience (CX) sector, 17% of consumers walk away after a single bad interaction.
What drives a patient to recommend a hospital in 2025? It is not parking, and there are no wait times. It is the perception of safety.
High perception of safety drives LTR to ~85.3, while a drop to “somewhat safe” crashes the score to 34.6.
Press Ganey data uncovers a rigid hierarchy of needs. “Likelihood to Recommend” (LTR) is pegged directly to how safe a patient feels.
Crucially, this is not just physical safety. It is emotional safety. Patients judge safety by teamwork. If they have to repeat their medical history to three different nurses, they perceive the team as disconnected.
In short:
Administrative friction is now interpreted by patients as a signal of system reliability.
The Digital & Financial Wedge
Healthcare NPS has declined by approximately 11 points over the last four years, driven largely by digital and administrative friction.
The gap between high-performing B2C models and traditional providers is defined by digital friction.
The “Amazon Effect” has normalized seamless transactions. Patients now expect their clinical and financial data to merge.
Providers clinging to paper-based billing or opaque pricing models are bleeding loyalty. “Integrated Patient Pay” systems–where the bill clearly explains the clinical service and the cost–are now standard.
81% of consumers indicate that a superior digital experience, from scheduling to bill payment, directly influences their willingness to recommend a provider. The bill is no longer an administrative afterthought.
If you’d like to learn more about the digital shift within the industry feel free to read our article on RCM trends

Let’s talk!
In just 15 minutes, we’ll cut through the noise and see if automation works for you.
RCM Statistics | 2026
In 2025, revenue cycle performance was defined by friction rather than growth.
Denials, administrative cost, and payer-driven complexity now shape cash flow more than volume or fee schedules. The data below shows how these forces are converging – and why traditional RCM operating models are failing to keep pace.
Denials Rate (DR) Up
In 2025 almost every source focused either on denials or payer friction. That’s probably the most characteristic theme of this year.
Experian’s 2025 State of Claims survey was the main “anchor”. The report claimed that:
In 2022, 30% of providers reported that at least 1/10 of claims were denied.
In 2024, that number rose to 38%.
In 2025, it’s now 41% of providers saying 1/10 of their claims are denied.
So in short: organizations tend to fall into a “double-digit denial rate” bucket each year – including 2025.
Denial rates above 10% are no longer manageable through staffing alone. Double-digit denial rates have become common enough to affect baseline financial planning.
Experian ties this to:
- Data errors at registration / intake
- Staffing shortages
- Outdated tech and fragmented systems feeding bad data into payers.
Denials issue in 2025 was mainly defined in this report by an accelerating severity in dollar value.
FierceHealthcare data reveals a sharp inflationary trend in rejected reimbursement, with the average value of denied inpatient claims rising 12% and outpatient claims 14% year-over-year.
This value surge compounds a volume crisis where double-digit denial rates are no longer outliers.
On top of that, over 41% of providers now report rates exceeding 10%, a figure reinforced by Kodiak Solutions’ benchmarking of an 11.8% industry average.
Crucially, they attributed modeling challenges to the assumption that this is primarily a provider-side data failure: while 43% of denials stem from submission errors, a dominant 54% are driven by strategic shifts in payer policy.
The mechanics of this friction are increasingly algorithmic and invasive, particularly in diagnostics.
Latest XiFin’s analysis of over 20 million claims highlights a distinct pivot toward AI-driven payer edits and automated medical necessity checks, which are aggressively targeting high-complexity molecular testing while expanding the battlefield from front-end rejections to post-payment recoupments.
The aggregate economic toll is severe:
Aptarro estimates that this cross-payer friction now consumes 3–5% of net patient revenue when lost income is combined with rework costs, cementing denials as a systemic tax on provider liquidity.
Many 2025 sources still refer to a Change Healthcare estimate that U.S. hospitals lose roughly $262B annually due to denied claims (originally based on 2016 data).
While not a fresh 2025 measurement, it sets the order of magnitude of the denial problem that current surveys are now tracking in more granular ways.
Cost to Collect & Admin Burden
In 2025, the industry definitively reframed “cost-to-collect” from a tactical back-office accounting metric into a primary strategic indicator.
The sheer scale of the administrative friction remains staggering.
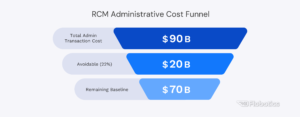
CAQH data estimates the annual price tag for routine transactions–eligibility, prior authorizations, claims, and remits–at approximately $90 billion across the U.S. medical system.
Crucially, the data suggests that fully automating these workflows could excise 22% of this burden, unlocking roughly $20 billion in immediate savings and reclaiming an estimated 70 minutes of administrative time per patient visit.
But the 2025 shift is less about aggregate potential and more about rigorous, standardized accountability.
While industry benchmarks, such as those cited by Zelis, typically place the cost-to-collect between 2% and 5% of net patient revenue, the definition has broadened to encompass the total weight of staffing, technology, vendor fees, and bad debt.
This comprehensive view has now been formalized at the executive level.
Kodiak Solutions launched a dedicated benchmarking survey late in the year to standardize the metric, while Black Book’s revamped framework at HFMA elevated cost-to-collect alongside denial write-offs as a central scorecard measure.
Consequently, the operational reality of 2025 is defined not merely by the rising volume of denials, but by the increasing expense of resolving them, cementing audit burden and collection efficiency as the dominant KPIs of the modern revenue cycle.
Automation, AI & Outsourcing
While different sources state that vendor-circulated figures show nearly three-quarters of hospitals have deployed some form of RPA or AI, CAQH data indicates that a substantial “automation gap” remains, with 22% of administrative spending still retrievable through fully electronic workflows.
The industry focus has consequently shifted from general experimentation to specific, high-yield applications: predictive denial prevention, intelligent worklist orchestration, and automated document classification.
The divergence between casual adopters and digitally mature organizations is stark; high-performing entities now utilize AI bots to manage over 50% of eligibility workflows, reporting 30–40% reductions in denial rates and slashing labor costs per claim by approximately 35%.
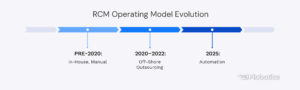
This technical complexity has catalyzed a parallel structural shift in labor strategy, where outsourcing has graduated from a temporary staffing stopgap to a permanent operational pillar.
KLAS reports confirm a distinct migration toward end-to-end outsourcing partnerships, with health systems rigorously evaluating vendors on hard outcomes like denial performance and cost-to-collect rather than mere functional coverage.
This evolution is further cemented by KPMG’s tracking of market consolidation, where private equity is aggressively fueling the merger of tech-enabled services and offshore operations.
Patient Responsibility & Cash-flow Pressure
Patient responsibility has become a primary source of cash-flow volatility.
Beyond the sanitized averages of formal industry reports, the operational reality of 2025 is best illuminated by the friction visible at the practitioner level, where cash flow volatility has become the defining characteristic of the fiscal year.
Field commentary suggests a crisis more acute than general benchmarks imply, with denial volumes surging 18–22% against recent baselines.
Simultaneously, the revenue mix has undergone a perilous structural shift:
Patient financial responsibility has swelled to constitute 35–40% of total revenue for many practices.
This creates a precarious liquidity trap where providers are squeezed between aggressive payer adjudication and the difficulty of collecting large balances from consumers–a challenge exacerbated by worsening front-desk turnover that directly degrades collection performance at the point of service.
This instability is rigorously quantified by Ensemble Health Partners, which notes that academic providers are enduring a compound annual growth rate in initial and final denials of 21% between 2022 and 2024.
The resulting financial profile is one of asymmetric pressure.
Even where patient volumes remain steady, the rising cost-to-collect and plunging cash collections per net patient revenue signal that the fundamental mechanics of provider liquidity are under siege.
Prior Authorization & Net Collections
2025 benchmarks from the AMA indicate that physicians and their staff now spend an average of 12–14 hours per week navigating authorization protocols.
According to the reports, companies process roughly 39 requests per physician weekly.
This administrative drag is no longer just a clinical annoyance. It is a hard cost that directly impacts the Net Collection Rate (NCR).
For 2025, the NCR benchmark–money actually collected vs. contractually allowed–must target 95–99%.
An NCR below 95% implies that revenue is effectively being “donated” to payers through inefficient follow-up or abandoned denials.
In a year defined by the “denial crisis,” maintaining a high NCR requires a rigorous defense of every billable dollar, ensuring that the friction of prior authorization does not translate into permanent revenue leakage.
Days in A/R
While strategy shifts, the fundamental speedometer of revenue cycle health remains Days in Accounts Receivable (A/R).
In 2025, the margin for error has narrowed significantly. The industry standard for a healthy organization remains 30–40 days, but top-performing organizations leveraging AI-driven workflows are now pushing this benchmark below 25 days.
The danger zone has also become more defined: consistent A/R days above 50 in 2025 signals a structural process breakdown, not just a temporary backlog. With the cost of capital remaining non-trivial, allowing claims to languish beyond this threshold is actively eroding margin.
The 2025 mandate is clear: automation must be applied to compress the cycle time between service and settlement, turning A/R from a “waiting room” into a high-velocity clearinghouse.
The Clean Claim Standard
As the HFMA (Healthcare Financial Management Association) “MAP Keys” shows, the Clean Claim Rate (CCR) or First Pass Resolution has graduated from an efficiency metric to a survival metric.
The 2025 gold standard for claims accepted without rejection on the first submission is 95% or higher.
Falling below 90% is now considered a critical failure point, as it exposes the organization to the compounding costs of rework and the increasing likelihood of complex denials. Lower acceptance rates increase both administrative cost and payment latency.
Industry data suggests a widening gap:
While average performers hover around 95%, elite organizations using predictive claim scrubbing are consistently hitting 98%+.
Every percentage point dropped in CCR correlates directly with increased administrative cost-to-collect and a delayed cash position, making front-end accuracy the single most effective lever for protecting net revenue.
Taken together, these forces turn denial management from an operational issue into a liquidity risk.
RCM Statistics | Recent Years
If the distinct data points of 2025 are assembled into a coherent whole, they reveal an industry defined not by gradual evolution, but by an aggressive structural reset.
The prevailing narrative has shifted from “managing denials” to surviving a “denial crisis,” with practitioner discourse universally flagging a deterioration in payer behavior that is structurally worse than the 2022–2024 baseline.
This is no longer just about initial rejections; the threat has expanded to include aggressive post-payment audits and recoupments, creating a scenario where claims that initially pay are increasingly clawed back.
This escalation is driven by a visible AI arms race.
Payers have successfully deployed automated logic for policy enforcement and utilization management, forcing providers to rapidly counter-arm with predictive analytics, autonomous coding, and algorithmic worklist orchestration simply to maintain parity.
This new volatility has reshaped the executive scorecard.
“Cost-to-collect” has graduated from a secondary finance metric to a headline KPI, now positioned by HFMA, Black Book, and Kodiak alongside Days in A/R as a critical measure of organizational health.
To manage this cost, the market has normalized outsourcing as a permanent strategic lever rather than a temporary staffing fix, while simultaneously attracting heavy venture capital and private equity investment into a new wave of tech-driven RCM startups like AKASA and PayZen.
The result is a fundamental repositioning of the sector: RCM in 2025 is no longer a back-office administrative function, but an AI-intensive, capital-heavy industry operating on the front lines of financial defense.
If 2025 proved anything, it’s that revenue cycle management is no longer something hospitals can afford to treat as background noise.
The shift didn’t arrive with a single regulatory shock or headline-grabbing mandate. Instead, it showed up in spreadsheets, denial queues, and finance meetings that kept getting longer.
Taken together, these trends point to rising operational risk within the revenue cycle.
RCM Statistics | Summary
Looking back, 2025 did not redefine revenue cycle management overnight. It did something quieter and more lasting. It made clear that getting paid had become a strategic discipline – one that demanded sustained attention, investment, and, above all, realism about how hard the work had become.
Looking for an RCM automation partner specializing in the healthcare sector?
Let’s talk!
Sources:
- State of Claims 2025 – Experian Health
- RCM KPI Benchmarking Report 2025 – Kodiak Solutions
- Payor Denial Impact Report 2025 – XiFin
- RCM Outsourcing & Performance Report 2025 – KLAS Research
- Healthcare Cost-to-Collect Benchmarks 2025 – HFMA
Like the article? Spread the word
Ready to automate your business processes?
Karl – our CTO loves to discuss the ROI. Feel free to book a call with him.
In just 15 minutes, we’ll help you assess whether automation is right for you.